YOUR POSITION
See where your current pay sits for your job.
See where your pay sits, the next salary level the evidence supports, what to say and what to do if salary cannot move, all personalised to the job you actually do.
Checked 29 August 2026See where your current pay sits for your job.
Get your Next Pay Marker: the next salary level the evidence supports.
See whether your position points to BUILD, ASK or EXPLORE.
Know what evidence to bring, what to say and which fallback options to use if salary cannot move.
See what your pay works out to after tax, commuting costs, travel time and unpaid overtime.
Built from published Office for National Statistics pay evidence and personalised to your occupation, region, working pattern and current pay.
Answer the guided questions once. Get one practical Blueprint online. No spreadsheets, no salary-site trawl, no subscription and no account.
Your personalised Pay Rise Blueprint costs £12.99 once.
It cannot guarantee a pay rise. It can replace guesswork with a clearer position, number and plan.
Prepare before the conversation, not after it.
Clearer or refunded. Read your Blueprint. If it does not give you a clearer understanding of your pay position and next move, email us within 14 days for a refund.
See roughly where your income sits among UK taxpayers. It is useful context, but it does not show whether you are paid fairly for your particular job.
| Rank | What it means | Gross income |
|---|---|---|
| Top 1% | 99th An unusually high income | £207,000 |
| Top 2% | 98th Upper-income benchmark | £150,000 |
| Top 3% | 97th High-income benchmark | £120,000 |
| Top 5% | 95th Well above most taxpayers | £93,600 |
| Top 10% | 90th A strong upper-income marker | £67,400 |
| Top 20% | 80th Into the top fifth of UK incomes | £50,000 |
| Top 25% | 75th Above about three quarters | £45,000 |
| Midpoint | 50th Halfway up the taxpayer range | £29,700 |
Source: HMRC Survey of Personal Incomes 2023/24. Individual gross income before tax, taxpayers only. Use the full percentile calculator for your exact rank, the top 0.5% and top 0.1% guide anchors, and your take-home at that level.
This ladder compares you with UK taxpayers across different jobs and working patterns. It gives you useful context, but it cannot tell you whether your pay is weak, competitive or already strong for your actual job.
For a pay review, progression decision or job move, the more useful question is: what is the strongest pay move for the job I actually do?
That is why the Pay Rise Blueprint uses ONS occupation data. It compares your pay with the published range for your job and working pattern, then turns the evidence into a BUILD, ASK or EXPLORE move. Where the UK occupation evidence supports one, it gives you a practical Next Pay Marker. It also adds published regional occupation context where available and keeps that local context separate from the national marker.
HMRC and ONS answer different questions: HMRC shows national income rank, while ONS shows published employee pay by occupation.
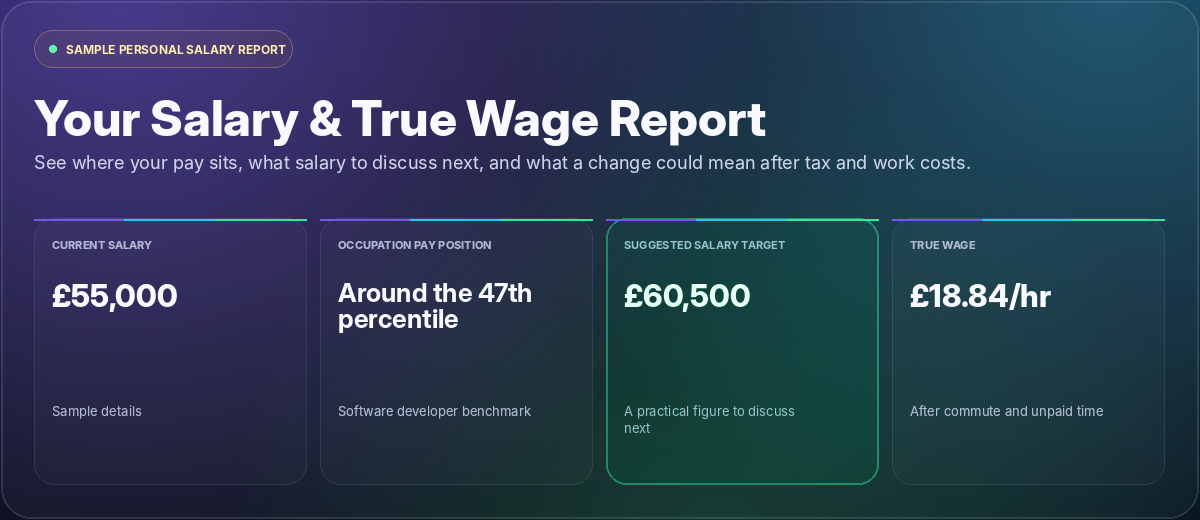
No mystery box. Open the same report format a buyer receives and see the kind of answers it gives, using sample details.
A full-time software developer earning £55,000 in North West England, commuting 45 minutes each way on three on-site days a week at a cost of £150 a month.
Your report uses the details you enter and the best available published data for your job and working pattern.
The value is not another salary average. It is knowing what the evidence means for your next move, and having a practical way to act on it.
If the Blueprint does not give you a clearer understanding of where your pay stands and what to do next, email hello@payprecision.co.uk within 14 days and we will refund the payment. No form or explanation needed.
You can see your personalised result and decide whether it was worth the one-off £12.99.
Many salary sites rely on figures submitted by users. PayPrecise uses the ONS Annual Survey of Hours and Earnings, the UK’s official published earnings data.
When detailed data is unavailable, the report tells you and clearly labels the alternative used.
Confirm your gross annual pay, occupation, work region and working setup. Add student-loan, commuting and unpaid-overtime details only if you want the Blueprint personalised further.
One payment of £12.99. No subscription and no PayPrecise account.
See your position, strongest move, Next Pay Marker where supported, True Wage and Pay Rise Plan online. You also get a PDF and a secure email link to reopen it later.
PayPrecise uses published ONS data and UK tax rules to create a personalised estimate. Your report shows the sources and assumptions behind the figures.
The current report uses ONS Annual Survey of Hours and Earnings (ASHE) 2025 provisional data.
Income Tax, National Insurance and student-loan figures are estimates based on the UK 2026/27 rules, so your payslip may differ slightly.
The Blueprint covers most UK jobs with published ONS data. You can search for your job title before paying. When detailed data is unavailable, the report clearly explains what alternative it uses.
Salary sites usually show a broad average, often based on figures submitted by users. PayPrecise uses published ONS data for your occupation and working pattern, then turns the comparison into a BUILD, ASK or EXPLORE move, a practical Next Pay Marker where the evidence supports one, and a role-specific Pay Rise Plan. Regional occupation context is kept separate from the UK-wide marker.
Email us within 14 days and we will refund it. No form or explanation needed.
The Office for National Statistics Annual Survey of Hours and Earnings, including its 2025 provisional occupation and regional data. Your Blueprint lists the sources and assumptions used.
A personalised Pay Rise Blueprint online, a downloadable PDF and a secure email link to reopen it. It covers your occupation pay position, BUILD / ASK / EXPLORE move, Next Pay Marker where supported, take-home estimates, Your True Wage, pay-change scenarios and Your Pay Rise Plan.
The Blueprint is not designed to tell everyone they are underpaid. A competitive result can lead to BUILD instead: protect your current position, improve the overall deal and build evidence for the next level. If you add commute and unpaid-time details, Your True Wage can also show whether a strong headline salary still has hidden costs.
For structured-pay roles such as teaching, NHS, Civil Service, police or fire, the Blueprint can recognise that an arbitrary salary demand may be inappropriate. It uses wider ONS pay as context and focuses the action plan on the real band, grade, progression, role-review or promotion route.
Yes. Your Pay Rise Plan adapts the approach to your salary level, benchmark position and goal. You get an evidence-backed Next Pay Marker where the UK occupation data supports one, evidence themes to prepare, responses to likely pushback and worthwhile fallback options if salary cannot move.
Your details are used to generate your Blueprint and are not sold or shared. Checkout runs through Stripe, so PayPrecise never receives or stores your full card details. You do not need to create an account.
It is one payment of £12.99 with no subscription. It cannot guarantee a pay rise or job offer. Its job is to replace guesswork with published evidence, a clearer pay move and a practical conversation plan.
Know where you stand, the move worth testing, the evidence to bring and what to say next. Build your Pay Rise Blueprint and keep it ready for your next review, progression conversation, application or offer.
Build my Pay Rise Blueprint — £12.99One-off £12.99 · No subscription · 14-day refund if it is not useful
Start with the free salary percentile calculator. It shows where your income sits among UK taxpayers and needs no email address. Come back when you want the job-specific evidence, strongest move and conversation plan.