The UK’s median household income was £719 a week before housing costs in 2024/25, about £37,400 a year, after tax and adjusted for household size. For a couple without children, that is about £3,116 a month. Compare your household below.
By Dan, PayPrecise · Checked · DWP income data: 2024/25 · Tax scenarios: 2026/27
Two households can each earn £100,000 a year and have very different amounts left after tax. The earnings split matters. So does the number of people that income supports.
01 · The earnings split
One £100,000 salary or two £50,000 salaries?
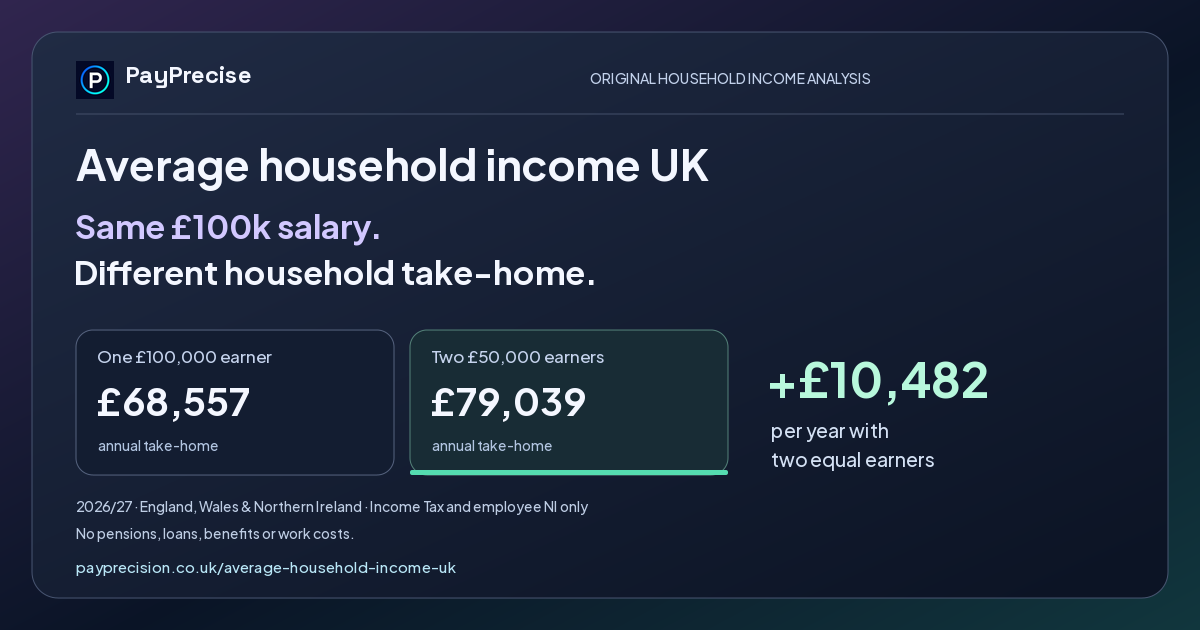
£10,482 more take-home a year with two equal earners
One £100k earner£68,557 net
Two £50k earners£79,039 net
Income Tax is charged per person. Two earners each use their own allowances and tax bands. Figures include Income Tax and NI only, for 2026/27 England, Wales and Northern Ireland.
For a couple without children, the equivalent monthly benchmark is £3,116. The extra £1,246 allows for the two children in DWP’s household-size scale. It does not represent childcare costs.
Derived from DWP 2024/25 data, before housing costs. A comparison benchmark, not a family budget.
Compare with the UK median, or compare one earner with two.
What is the average household income in the UK?
The latest DWP figures put median household income at £719 a week before housing costs and £623 after housing costs in 2024/25. These are after-tax incomes adjusted for household size. The median marks the midpoint: half of people have a higher size-adjusted household income and half have a lower one.
DWP uses a couple without children as its reference household. The £719 weekly figure works out at about £3,116 a month or £37,388 a year. Both medians rose by 5% after inflation compared with 2023/24.
The mean household income was £855 a week before housing costs, about £44,460 a year, on the same size-adjusted basis. It is higher than the median because large incomes pull up the arithmetic average. Both figures come from DWP’s published tables.
Why does ONS give a different figure?
The ONS bulletin for the financial year ending 2024 reports a median of £36,700. It covers an earlier period and uses a different survey. The two figures should not be treated as consecutive years in the same series. The ONS release for FYE 2025 is scheduled for 2 October 2026. It had not been published when we checked on 28 September 2026.
Household income for singles, couples and families
Income has to stretch further when more people depend on it. This table translates the national median into monthly amounts for different household sizes, using DWP’s published weights. These are comparison benchmarks, not surveyed averages for each family type.
Monthly equivalents · DWP 2024/25 · approximate, rounded to £1
Household-size income benchmarks
Household
Before housing costs
After housing costs
One adult
£2,087
£1,566
Couple, no children
£3,116
£2,700
One adult, one child under 14
£2,711
£2,106
Couple, one child under 14
£3,739
£3,240
Couple, two children under 14
£4,362
£3,780
Couple, two dependent children aged 14+
£5,172
£4,967
A couple with two young children needs 40% more than a couple without children to reach the same before-housing benchmark: £4,362 rather than £3,116 a month.
The columns use separate medians and scales. Their difference is not a measure of typical housing costs.
One salary or two: how much does take-home change?
Income Tax and employee NI are calculated for each earner. We keep combined gross pay the same and change how it is split. The table excludes pensions, student loans, benefits and work costs.
PayPrecise model · 2026/27 England, Wales and Northern Ireland · annual amounts
One versus two earners at the same gross pay
Combined gross salary
One earner: net
Equal split: net
Equal-split advantage
Combined gross salary£40,000
One earner: net£32,319.60
Equal split: net£35,839.20
Equal-split advantage£3,519.60
Combined gross salary£60,000
One earner: net£45,357.40
Equal split: net£50,239.20
Equal-split advantage£4,881.80
Combined gross salary£80,000
One earner: net£56,957.40
Equal split: net£64,639.20
Equal-split advantage£7,681.80
Combined gross salary£100,000
One earner: net£68,557.40
Equal split: net£79,039.20
Equal-split advantage£10,481.80
Combined gross salary£120,000
One earner: net£76,157.40
Equal split: net£90,714.80
Equal-split advantage£14,557.40
Combined gross salary£150,000
One earner: net£91,286.40
Equal split: net£108,114.80
Equal-split advantage£16,828.40
Why two £50,000 salaries leave more
One £100,000 earner pays £27,432 Income Tax and £4,010.60 NI. Two £50,000 earners pay £14,972 tax and £5,988.80 NI between them. They pay more NI but much less Income Tax, keeping £10,482 more overall.
With two children, the £80,000 gap widens
Child Benefit depends on each parent’s adjusted net income. With one £80,000 earner, the High Income Child Benefit Charge repays the full benefit. Two £40,000 earners face no charge. For two qualifying children, the 2026/27 rates add up to £2,337.40 over 52 weeks.
Under 2026/27 England, Wales and Northern Ireland tax rules, that widens the annual gap from £7,681.80 after tax and NI to £10,019.20 including retained Child Benefit. The one-earner household keeps £56,957.40; the two-earner household keeps £66,976.60. This example assumes adjusted net income equals salary, full-year Child Benefit eligibility and no other income or deductions. It is separate from the salary-only calculator. Use the Child Benefit charge calculator for your circumstances.
When extra work costs absorb the difference
Additional childcare and work costs of £873.48 a month would absorb the £100,000 equal split’s tax advantage. This is a break-even illustration, not an estimate of a family’s costs. Use the salary after childcare calculator to include those costs.
The earnings split also affects the £100,000 income limit per parent for childcare support. Two £60,000 or £75,000 earners pass that income test where one £120,000 or £150,000 earner would not, assuming adjusted net income equals salary. Other eligibility rules still apply, including work status and children’s ages. The £100k childcare cliff calculator covers Tax-Free Childcare and England’s funded hours.
Original PayPrecise analysis
What single salary matches two £50,000 incomes?
£126,900Approximate gross salary · England, Wales or Northern Ireland
Two £50,000 salaries leave £79,039 a year after Income Tax and NI. To keep the same amount, a single earner needs about £126,892 gross. That is 26.9% more than the couple’s combined pay.
Raising one salary by the £10,482 net gap is not enough: the extra pay is taxed too. The £100k tax trap makes catching up harder by reducing the Personal Allowance above £100,000. At £125,140, that allowance has gone.
2026/27 · annual gross amounts · each column matches two earners in that region
Single salaries matching two equal earners
Two earners: combined pay
Single salary: England, Wales, NI
Single salary: Scotland
Two earners: combined pay£40,000£20,000 each
Single salary: England, Wales, NI£44,888
Single salary: Scotland£45,790
Two earners: combined pay£60,000£30,000 each
Single salary: England, Wales, NI£68,417
Single salary: Scotland£71,967
Two earners: combined pay£80,000£40,000 each
Single salary: England, Wales, NI£93,244
Single salary: Scotland£98,588
Two earners: combined pay£100,000£50,000 each
Single salary: England, Wales, NI£126,892
Single salary: Scotland£131,384
Two earners: combined pay£120,000£60,000 each
Single salary: England, Wales, NI£148,922
Single salary: Scotland£153,719
Two earners: combined pay£150,000£75,000 each
Single salary: England, Wales, NI£181,752
Single salary: Scotland£187,319
In Scotland, the equivalent single salary is £131,384. Its different tax bands affect both sides of the comparison.
Income Tax and employee NI only. Unlike the previous table, this calculation changes gross salary until take-home matches.
What counts as household income?
Household income includes more than wages. The median comparison counts income from all relevant sources after tax and specified deductions. The earnings-split calculator looks only at employment salaries.
Income and deductions to include
Include net earnings, self-employment income, benefits, pensions, investment income, maintenance received, student loans and grants received, and relevant benefits in kind. Deduct tax, NI, pension contributions, student-loan repayments, maintenance paid and parental support to students living away.
The calculator deducts Council Tax or domestic rates separately. Do not deduct everyday spending. Check DWP’s full definition for complex circumstances. The measure covers private households and assumes shared resources.
Which housing costs count?
Include rent before Housing Benefit, mortgage interest, water charges, buildings insurance, ground rent and service charges. Include Housing Benefit in income. Exclude mortgage principal and energy bills.
Scottish water and sewerage charges should be counted as housing costs, not Council Tax, and deducted only once. Northern Ireland has no separate direct domestic water charge.
Data and methodology
The household benchmarks use DWP’s published medians and household-size weights. PayPrecise calculated the earnings splits, equivalent single salaries and break-even comparisons. These calculations are modelled scenarios, not survey findings.
Household benchmark method
Weekly median × household factor × 52 ÷ 12
Before housing costs, the factor is 0.67 for the first adult, 0.33 for each additional adult or dependent child aged 14+, and 0.20 for each child under 14. After housing costs, the first two weights become 0.58 and 0.42.
Source medians and weights are rounded, so conversions are approximate. Negative before-housing income is floored at zero; after-housing income can be negative. Results show distance from the median, not an income percentile, and are not adjusted to September 2026 prices.
Tax assumptions and reproducibility
We apply 2026/27 Income Tax to each earner, including the Personal Allowance taper above £100,000. Standard employee NI uses annual thresholds of £12,570 and £50,270, at 8% and 2%. Both adults are below State Pension age.
No pension, loan, Marriage Allowance, other-income, benefit or work-cost adjustments are included in the salary calculator. Each person must earn their own salary. Monthly take-home is annual net pay ÷ 12, rounded to pennies. The displayed monthly difference subtracts those rounded amounts; it can differ by 1p from the unrounded annual difference ÷ 12. Actual payroll rounding may differ.
The dataset covers 23 combined salaries from £40,000 to £150,000, four splits and two regions: 184 salary-only scenarios. Each includes a single salary that matches the selected split’s net income, solved before rounding with the same tax model. Six household benchmarks and the separate two-child Child Benefit example are also included. Tax tables and downloads retain pennies; household benchmarks and headline findings use rounded pounds.
Calculator inputs are not stored, added to URLs or sent to our servers by this tool.
PayPrecise, “Average household income UK: how do you compare?”, reviewed 28 September 2026. 2026/27 tax analysis; household benchmarks derived from DWP HBAI FYE 2025. payprecision.co.uk/average-household-income-uk/
Original calculations: CC BY 4.0 with attribution. Official inputs: Open Government Licence.
Checked 28 September 2026. DWP period: April 2024–March 2025. Tax model: 6 April 2026–5 April 2027.
Household income questions
Is household income before or after tax?
The DWP benchmark is net disposable income, adjusted for household size. The earnings-split calculator starts with gross salaries and deducts Income Tax and NI.
Is £60,000 a good household income?
If £60,000 is combined gross pay, one salary leaves about £3,780 a month after tax and NI; two £30,000 salaries leave about £4,187 under 2026/27 England, Wales and Northern Ireland rules. The monthly before-housing median benchmark is £3,116 for a couple without children and £4,362 for a couple with two children under 14.
Before comparing, include benefits and other net income, then deduct pensions, loan repayments, Council Tax and any other DWP-defined deductions. If £60,000 is already net disposable income on that basis, its £5,000 monthly equivalent exceeds both benchmarks. Neither benchmark measures whether your income covers your costs.
Does “20% above median” mean the top 20%?
No. It means 20% above the median benchmark. A percentile requires the full income distribution, not just its midpoint.
Are these 2026 household-income figures?
The DWP data covers April 2024–March 2025. The tax examples use 2026/27 rules. Both were checked in September 2026.