Highest paying jobs in the UK
Compare all 412 UK occupations using official ONS ASHE salary data. Chief executives and senior officials have the highest published median full-time salary at £99,944, while teaching assistants have the lowest at £21,239. Search any job title or explore the complete rankings below.
What the highest paying jobs in the UK actually pay
The distance between the top and the bottom of the UK labour market is bigger than most salary guides let on. Chief executives and senior officials have a median full-time salary of £99,944. Teaching assistants have a median of £21,239. Both numbers come from the same ONS survey, measured in the same month, on the same basis.
Between those two ends sit another 380 occupations with a published figure. The midpoint of that list is £35,426, and only 143 of them pay more than the UK full-time median of £39,039. That is worth holding on to when a careers site quotes a job at “£40,000 to £60,000”, because £40,000 already places a role in the better paid half of the country.
Three lists follow. The 20 highest paying jobs in the UK, the 20 lowest paid, and the best paid jobs where a degree is not the usual way in. Under those is the full searchable table for all 412 occupations, so you can look up your own job title rather than take a top ten on trust.
Where we have written a job up in full, the guides for train drivers, electricians, teachers and software developers go further into progression, take-home pay and regional differences. And if the question you actually came with is where your own salary sits rather than what the job pays on average, that is what the salary percentile calculator is for.
The 20 highest paying jobs in the UK
Ranked on median gross annual pay for full-time employees, April 2025. Median means the middle salary in that occupation, so half the people doing the job earn less than the figure shown and half earn more.
Two things stand out. The first is how much of this list is management rather than profession. Seven of the top ten are director or senior manager titles, and the only profession in the top three is specialist medical practitioners and consultants at £92,847. If you are chasing a high salary through qualifications alone, medicine is close to the ceiling.
The second is the gap between the two money columns at the top. Chief executives and senior officials have a median of £99,944 and an average of £158,728. An average that far above the median tells you the upper tail is very long, and that the typical person in the group earns nowhere near the headline average you see quoted elsewhere.
One outlier is worth a mention. Train and tram drivers come in eighth at £76,327, ahead of head teachers, senior police officers and every engineering profession in the dataset. No engineering profession in the dataset comes near it: the best paid, electrical engineers, sit at £60,303.
What separates typical pay from the better-paid quarter?
The ranking tells you which occupations pay more. The next question is how much pay can vary inside those occupations.
This is the median difference between those two published points, not an estimate of personal underpayment.
What it takes to reach the UK’s highest salaries
These are occupation medians, not starting salaries. Most people in the top ten have already built senior experience, completed regulated training or passed demanding employer selection.
| Occupation | Usual route | What to know |
|---|---|---|
| Chief executives and senior officials£99,944 median | Usually reached through senior management or by building and leading a business. | There is no single required qualification. The figure reflects people already carrying executive responsibility. |
| Marketing, sales and advertising directors£94,135 median | Progress through marketing, sales or commercial management. Degree, apprenticeship and work-based routes all exist. | Director pay normally follows a strong record of managing budgets, teams and commercial results. |
| Specialist medical practitioners and consultants£92,847 median | Medical degree, foundation training, specialist training and professional registration. | This is a long, regulated route. The occupation median is not a newly qualified doctor’s salary. |
| Information technology directors£91,671 median | Progress from technical, product or IT management roles into organisation-wide leadership. | Employers usually expect deep technical understanding plus senior people, budget and delivery responsibility. |
| Directors in logistics, warehousing and transport£83,447 median | Progress through logistics, transport, warehousing or supply-chain management. | The role normally follows substantial operational and leadership experience. |
| Aircraft pilots and air traffic controllers£82,746 median | Pilot licensing and flight training, or specialist air-traffic-control selection and training. | The ONS group combines two different regulated careers, both with medical or aptitude requirements. |
| Financial managers and directors£76,447 median | Progress through accounting, finance or commercial management. Professional qualifications are common. | The figure reflects management and director-level responsibility, not entry-level finance work. |
| Train and tram drivers£76,327 medianRead the train driver guide | Apply to an operator as a trainee and complete employer-led, safety-critical training. | A degree is not normally required, but selection, medical checks and route competence are demanding. |
| Functional managers and directors n.e.c.£75,711 median | Progress through a specialist area such as operations, compliance, facilities or service management. | This is a broad ONS group, so there is no single qualification or starting route. |
| Public relations and communications directors£72,887 median | Progress through PR, communications, media or marketing roles. | Director pay normally follows senior responsibility for campaigns, reputation, clients and teams. |
A high occupation median is not an entry-level promise. ONS measures employees already working in the occupation, including experienced and senior workers. Routes are summarised from the National Careers Service and official medical-career guidance; exact requirements vary by employer and profession.
Average salary by job title: search all 412 UK occupations
Ranked highest paid first. Type a job title or a SOC code to jump to it, filter by occupation group, or switch between full-time, part-time and all employees. Choose any job to see the published 25th to 75th percentile range.
Showing 50 of 412 occupations
Selected occupation
The published pay points show the market. Your Blueprint turns them into a personalised pay decision, with take-home and True Wage context where relevant.
| Occupation | SOC | Full-time typical pay | Full-time average pay | Next step |
|---|---|---|---|---|
| Chief executives and senior officialsDetailed guide | 1111 | £99,944 | £158,728 | |
| Marketing, sales and advertising directorsDetailed guide | 1132 | £94,135 | £113,940 | |
| Specialist medical practitioners and consultantsDetailed guide | 2212 | £92,847 | £103,044 | |
| Information technology directorsDetailed guide | 1137 | £91,671 | £110,618 | |
| Directors in logistics, warehousing and transportDetailed guide | 1140 | £83,447 | £97,876 | |
| Aircraft pilots and air traffic controllersDetailed guide | 3511 | £82,746 | Not published | |
| Financial managers and directorsDetailed guide | 1131 | £76,447 | £120,529 | |
| Train and tram driversDetailed guide | 8231 | £76,327 | £75,860 | |
| 1139 | £75,711 | £89,326 | ||
| 1133 | £72,887 | £84,306 | ||
| Head teachers and principalsDetailed guide | 2321 | £72,192 | £73,342 | |
| 1162 | £66,690 | £74,687 | ||
| 5236 | £64,322 | £65,069 | ||
| 1123 | £63,241 | Not published | ||
| 1171 | £61,573 | £71,598 | ||
| 3533 | £60,575 | £62,096 | ||
| Electrical engineersDetailed guide | 2123 | £60,303 | £61,559 | |
| 2133 | £60,288 | £67,274 | ||
| Business and financial project management professionalsDetailed guide | 2440 | £59,834 | £73,542 | |
| 1121 | £58,640 | £72,604 | ||
| 2131 | £58,373 | £61,787 | ||
| 2225 | £58,366 | £55,180 | ||
| 2439 | £58,341 | £58,872 | ||
| 1134 | £58,005 | £64,733 | ||
| 3556 | £57,625 | £67,172 | ||
| 1136 | £57,529 | £69,039 | ||
| 8234 | £57,088 | £58,716 | ||
| Solicitors and lawyersDetailed guide | 2412 | £56,977 | £73,424 | |
| Programmers and software development professionalsDetailed guide | 2134 | £56,914 | £63,810 | |
| 3531 | £56,689 | Not published | ||
| 2132 | £56,438 | £62,632 | ||
| 1122 | £56,021 | £63,892 | ||
| 2126 | £55,839 | £64,942 | ||
| 2161 | £55,519 | £64,408 | ||
| 2114 | £55,518 | Not published | ||
| 2211 | £55,494 | £58,674 | ||
| 1255 | £54,772 | £66,375 | ||
| 2135 | £54,647 | £59,627 | ||
| 2139 | £54,107 | £58,810 | ||
| ParamedicsDetailed guide | 2255 | £53,818 | £53,037 | |
| 2251 | £53,772 | £53,942 | ||
| 2432 | £53,703 | £61,810 | ||
| 2433 | £53,342 | £65,489 | ||
| 2431 | £53,295 | £59,929 | ||
| 2127 | £53,064 | £57,516 | ||
| 2311 | £52,835 | £55,437 | ||
| 2453 | £52,537 | £59,575 | ||
| 2124 | £52,518 | £59,843 | ||
| 2121 | £51,366 | £54,163 | ||
| 2122 | £51,110 | £55,148 | ||
| 2240 | £51,058 | £54,215 | ||
| 2252 | £51,030 | £59,614 | ||
| 2411 | £50,915 | £56,773 | ||
| 2422 | £50,330 | £64,198 | ||
| 2482 | £50,083 | £58,472 | ||
| Chartered and certified accountantsDetailed guide | 2421 | £50,062 | £55,414 | |
| 2423 | £49,850 | £63,605 | ||
| 1254 | £49,763 | £51,701 | ||
| 3534 | £48,980 | £56,655 | ||
| 2494 | £48,977 | £57,578 | ||
| 2137 | £48,907 | £53,896 | ||
| 2129 | £48,776 | £53,653 | ||
| 2141 | £48,629 | £48,131 | ||
| 5249 | £48,571 | £51,877 | ||
| 1172 | £48,549 | £50,235 | ||
| 2254 | £48,439 | £48,354 | ||
| 2224 | £47,971 | Not published | ||
| 2125 | £47,946 | £50,894 | ||
| 2113 | £47,892 | £53,074 | ||
| 3411 | £47,763 | £43,613 | ||
| 2256 | £47,699 | £51,468 | ||
| 2455 | £47,665 | £51,956 | ||
| Secondary education teaching professionalsDetailed guide | 2313 | £47,632 | £47,170 | |
| 1241 | £47,504 | £52,572 | ||
| 2316 | £47,432 | £45,304 | ||
| 2451 | £47,143 | £50,690 | ||
| 2136 | £47,118 | £48,610 | ||
| Midwifery nursesDetailed guide | 2231 | £46,990 | £48,988 | |
| 3415 | £46,591 | £49,384 | ||
| 2322 | £46,581 | £50,481 | ||
| 8221 | £46,463 | £51,173 | ||
| 3582 | £46,444 | £49,657 | ||
| 8153 | £46,403 | £48,467 | ||
| 1259 | £46,271 | £56,288 | ||
| 2454 | £46,184 | £49,741 | ||
| 1243 | £46,143 | £51,049 | ||
| 2234 | £46,069 | £45,878 | ||
| 6214 | £46,062 | £47,477 | ||
| Primary education teaching professionalsDetailed guide | 2314 | £45,939 | £45,535 | |
| 5234 | £45,779 | £49,529 | ||
| 3416 | £45,534 | £49,761 | ||
| 2223 | £45,511 | £44,716 | ||
| 2112 | £45,382 | £52,019 | ||
| 5250 | £45,150 | £47,659 | ||
| 2233 | £45,140 | £46,165 | ||
| 5330 | £45,021 | £46,820 | ||
| 3113 | £44,843 | £47,714 | ||
| 2162 | £44,580 | £49,461 | ||
| 2461 | £44,550 | £44,898 | ||
| 2323 | £44,549 | £46,883 | ||
| 2492 | £44,534 | £47,720 | ||
| 2222 | £44,040 | £43,164 | ||
| 3313 | £44,033 | £44,795 | ||
| 3319 | £44,007 | £47,413 | ||
| 2481 | £43,592 | £46,756 | ||
| 2221 | £43,532 | £43,457 | ||
| 2119 | £43,384 | £45,946 | ||
| 1251 | £43,365 | £54,340 | ||
| 2152 | £43,362 | £46,565 | ||
| 1232 | £42,700 | £45,881 | ||
| 2235 | £42,692 | £42,834 | ||
| 5214 | £42,580 | £40,698 | ||
| 1231 | £42,559 | £47,142 | ||
| 2491 | £42,451 | £49,583 | ||
| 2237 | £42,300 | £43,205 | ||
| 2312 | £42,218 | £43,649 | ||
| 2259 | £42,079 | £43,752 | ||
| 2236 | £41,963 | £40,779 | ||
| 2483 | £41,725 | £43,340 | ||
| 5246 | £41,662 | £44,015 | ||
| 3532 | £41,610 | £66,920 | ||
| 8151 | £41,548 | £43,899 | ||
| 3314 | £41,287 | £41,305 | ||
| 5225 | £41,166 | £45,432 | ||
| 2434 | £41,128 | £47,328 | ||
| 2232 | £40,897 | £41,923 | ||
| 5223 | £40,760 | £43,217 | ||
| 2469 | £40,594 | £40,358 | ||
| 2151 | £40,083 | £44,433 | ||
| 5224 | £40,062 | £46,635 | ||
| 5242 | £39,998 | £42,851 | ||
| 2111 | £39,983 | £49,758 | ||
| 8211 | £39,905 | £40,136 | ||
| 5222 | £39,902 | £43,878 | ||
| 2115 | £39,899 | £42,385 | ||
| 3429 | £39,779 | £44,633 | ||
| 8134 | £39,690 | £40,134 | ||
| Electricians and electrical fittersDetailed guide | 5241 | £39,647 | £41,190 | |
| 3541 | £39,634 | £48,046 | ||
| 3560 | £39,537 | £41,016 | ||
| 3412 | £39,459 | £47,931 | ||
| 8232 | £39,358 | £43,496 | ||
| 2329 | £39,114 | £48,218 | ||
| 5245 | £39,002 | £42,119 | ||
| 3573 | £38,981 | £40,426 | ||
| 3581 | £38,963 | £40,717 | ||
| 8152 | £38,833 | £39,961 | ||
| 4141 | £38,630 | £42,181 | ||
| 3544 | £38,572 | £45,103 | ||
| 1150 | £38,447 | £47,631 | ||
| 6116 | £38,447 | £38,262 | ||
| 8132 | £38,301 | £39,714 | ||
| 1211 | £38,182 | £44,744 | ||
| 2471 | £38,068 | £44,525 | ||
| 1223 | £38,043 | £41,971 | ||
| 3133 | £37,995 | £41,699 | ||
| 9121 | £37,925 | £38,309 | ||
| 3552 | £37,924 | £46,561 | ||
| Plumbers and heating and ventilating installers and repairersDetailed guide | 5315 | £37,881 | £38,337 | |
| 8229 | £37,864 | £39,037 | ||
| 2229 | £37,599 | £39,897 | ||
| 2315 | £37,593 | £41,934 | ||
| 2493 | £37,563 | £41,422 | ||
| 4143 | £37,535 | £42,025 | ||
| 2317 | £37,514 | £39,399 | ||
| 1242 | £37,470 | £40,240 | ||
| 5231 | £37,458 | £38,213 | ||
| 3551 | £37,306 | £40,923 | ||
| 3114 | £37,229 | £38,193 | ||
| 5212 | £37,058 | £40,114 | ||
| 3116 | £36,895 | £41,245 | ||
| 3422 | £36,848 | £43,399 | ||
| 8160 | £36,777 | £40,020 | ||
| 2464 | £36,620 | £37,882 | ||
| 3421 | £36,485 | £38,597 | ||
| 2452 | £36,457 | £44,122 | ||
| 1221 | £36,419 | £40,981 | ||
| 7213 | £36,415 | £36,370 | ||
| 3574 | £36,357 | £38,385 | ||
| 8212 | £36,340 | £37,195 | ||
| 7131 | £36,304 | £40,096 | ||
| 3119 | £36,102 | £38,987 | ||
| 1224 | £36,026 | £37,538 | ||
| 9259 | £35,863 | £36,816 | ||
| 5311 | £35,824 | £38,257 | ||
| 3543 | £35,751 | £38,266 | ||
| 6311 | £35,748 | £35,512 | ||
| 7220 | £35,723 | £38,206 | ||
| 5221 | £35,718 | £37,162 | ||
| 8239 | £35,670 | £40,493 | ||
| 2419 | £35,507 | £65,429 | ||
| 5213 | £35,344 | £37,993 | ||
| 5111 | £35,295 | £38,670 | ||
| 3131 | £35,259 | £39,810 | ||
| 3120 | £35,221 | £37,639 | ||
| 3549 | £35,209 | £44,390 | ||
| 3571 | £35,194 | £40,029 | ||
| 3132 | £35,128 | £38,825 | ||
| 3112 | £35,126 | £40,977 | ||
| 1225 | £35,105 | £37,171 | ||
| 5232 | £34,999 | £36,525 | ||
| 4215 | £34,954 | £37,951 | ||
| 5319 | £34,822 | £38,523 | ||
| 3542 | £34,757 | £38,454 | ||
| 8233 | £34,700 | £37,726 | ||
| 3223 | £34,688 | £34,646 | ||
| 3520 | £34,662 | £41,051 | ||
| 5233 | £34,531 | £37,070 | ||
| 2319 | £34,396 | £36,146 | ||
| 8143 | £34,360 | £37,283 | ||
| 2472 | £34,237 | £36,514 | ||
| 5244 | £34,237 | Not published | ||
| 5321 | £34,016 | £34,291 | ||
| 5316 | £34,014 | £37,256 | ||
| 3115 | £33,972 | £36,989 | ||
| 8113 | £33,959 | £37,932 | ||
| 5312 | £33,938 | £35,061 | ||
| 5235 | £33,896 | £35,211 | ||
| 9231 | £33,832 | £33,880 | ||
| 4134 | £33,508 | £34,549 | ||
| 6132 | £33,465 | £35,058 | ||
| 3554 | £33,412 | £41,107 | ||
| 4142 | £33,174 | £35,779 | ||
| 5442 | £33,078 | £35,836 | ||
| 5313 | £33,030 | £33,379 | ||
| 5422 | £33,019 | £33,726 | ||
| 1212 | £33,011 | Not published | ||
| 4111 | £33,000 | £35,820 | ||
| 8219 | £32,892 | £34,598 | ||
| 8115 | £32,871 | £33,822 | ||
| 5322 | £32,861 | £33,794 | ||
| 5323 | £32,763 | £34,106 | ||
| 3221 | £32,654 | £33,239 | ||
| 8114 | £32,644 | £32,064 | ||
| 3417 | £32,643 | £39,665 | ||
| 2142 | £32,510 | £35,344 | ||
| 8159 | £32,446 | £33,714 | ||
| 3572 | £32,418 | £37,472 | ||
| 5211 | £32,207 | £33,959 | ||
| 3557 | £32,163 | £35,940 | ||
| 3553 | £32,155 | £35,589 | ||
| 1256 | £31,961 | £34,237 | ||
| 4124 | £31,943 | £33,418 | ||
| 8142 | £31,919 | £34,352 | ||
| 5314 | £31,906 | £39,150 | ||
| 6134 | £31,871 | £30,946 | ||
| 7115 | £31,851 | £33,708 | ||
| 8119 | £31,717 | £33,162 | ||
| 1222 | £31,692 | £33,185 | ||
| 9211 | £31,677 | £32,585 | ||
| 1257 | £31,626 | £44,857 | ||
| 7212 | £31,568 | £30,767 | ||
| 4122 | £31,560 | £34,543 | ||
| 8120 | £31,500 | £33,999 | ||
| 7129 | £31,480 | £33,441 | ||
| 8222 | £31,279 | £32,719 | ||
| 2463 | £31,183 | £33,840 | ||
| 3224 | £31,124 | £34,348 | ||
| 3212 | £31,044 | £32,101 | ||
| 9251 | £31,010 | £32,285 | ||
| 4113 | £31,008 | £35,507 | ||
| 3222 | £31,001 | £32,171 | ||
| 8144 | £30,918 | £32,977 | ||
| 6138 | £30,894 | £31,205 | ||
| 4112 | £30,886 | £31,928 | ||
| 3555 | £30,648 | £35,990 | ||
| 3219 | £30,575 | £33,728 | ||
| 8145 | £30,500 | £32,412 | ||
| 7113 | £30,495 | £30,842 | ||
| 8131 | £30,360 | £31,134 | ||
| 4132 | £30,269 | £34,761 | ||
| 4123 | £30,265 | £32,980 | ||
| 2324 | £30,140 | £31,346 | ||
| 3432 | £30,108 | £36,985 | ||
| 9111 | £30,101 | £31,902 | ||
| 3229 | £30,087 | £30,788 | ||
| 5119 | £30,062 | £31,695 | ||
| 5434 | £30,010 | £31,213 | ||
| 4133 | £29,991 | £33,278 | ||
| 3213 | £29,931 | £31,971 | ||
| 8135 | £29,925 | £32,209 | ||
| 5436 | £29,789 | £31,909 | ||
| 1253 | £29,715 | £28,360 | ||
| 9139 | £29,619 | £30,158 | ||
| 6312 | £29,559 | £29,469 | ||
| 5317 | £29,436 | £31,146 | ||
| 9262 | £29,409 | £30,430 | ||
| 6136 | £29,381 | £29,804 | ||
| 5449 | £29,340 | £33,101 | ||
| 8139 | £29,259 | £32,322 | ||
| 9221 | £29,185 | £29,129 | ||
| 7132 | £29,172 | £31,008 | ||
| 5432 | £29,117 | £30,186 | ||
| 7122 | £29,097 | £30,927 | ||
| 6131 | £29,084 | £29,658 | ||
| 4129 | £28,996 | £31,760 | ||
| 6232 | £28,950 | £30,403 | ||
| 5441 | £28,936 | £31,705 | ||
| 3240 | £28,893 | £28,771 | ||
| 5431 | £28,859 | £29,731 | ||
| 9253 | £28,749 | £29,220 | ||
| 6212 | £28,746 | £32,625 | ||
| 4151 | £28,745 | £29,692 | ||
| 6213 | £28,738 | £30,709 | ||
| 4131 | £28,656 | £29,985 | ||
| 8141 | £28,620 | £30,379 | ||
| 6240 | £28,605 | £30,958 | ||
| 9129 | £28,591 | £29,950 | ||
| 3211 | £28,543 | £29,623 | ||
| 5113 | £28,539 | £29,746 | ||
| 4121 | £28,532 | £30,288 | ||
| 6121 | £28,323 | £29,850 | ||
| 4152 | £28,316 | £29,599 | ||
| 4159 | £28,294 | £30,040 | ||
| 5114 | £28,288 | £30,014 | ||
| 8111 | £28,243 | £29,453 | ||
| 3111 | £28,210 | £31,258 | ||
| 4135 | £28,134 | £29,067 | ||
| 8149 | £27,962 | £29,684 | ||
| 8112 | £27,915 | £30,526 | ||
| 5411 | £27,909 | £29,597 | ||
| 3214 | £27,888 | £26,320 | ||
| 9225 | £27,857 | £28,641 | ||
| 8214 | £27,854 | £29,419 | ||
| 7219 | £27,848 | £29,674 | ||
| 9252 | £27,832 | £28,646 | ||
| 9222 | £27,633 | £28,309 | ||
| 5421 | £27,497 | £29,080 | ||
| 6135 | £27,468 | £27,577 | ||
| 7123 | £27,401 | £28,560 | ||
| 5423 | £27,315 | £29,203 | ||
| 9131 | £27,306 | £29,118 | ||
| 3433 | £27,273 | £28,994 | ||
| 5112 | £27,262 | £27,439 | ||
| 4217 | £27,170 | £27,657 | ||
| 7211 | £27,035 | £28,807 | ||
| 4212 | £26,968 | £29,332 | ||
| 4211 | £26,958 | £27,724 | ||
| 6211 | £26,934 | £28,005 | ||
| 4136 | £26,851 | £28,414 | ||
| 8213 | £26,783 | £28,465 | ||
| 9119 | £26,737 | £27,660 | ||
| 6219 | £26,656 | £26,878 | ||
| 9219 | £26,631 | £27,055 | ||
| 9226 | £26,598 | £27,385 | ||
| 5419 | £26,573 | £27,644 | ||
| 4213 | £26,463 | £26,818 | ||
| 9132 | £26,152 | £27,474 | ||
| 9261 | £26,019 | £26,244 | ||
| 7125 | £25,845 | £26,178 | ||
| 9229 | £25,780 | £27,243 | ||
| 6133 | £25,742 | £26,260 | ||
| 3231 | £25,434 | £25,883 | ||
| 5433 | £25,394 | £27,093 | ||
| 5412 | £25,357 | £27,238 | ||
| 9269 | £25,344 | £25,950 | ||
| 6231 | £25,335 | £25,500 | ||
| 5413 | £25,212 | £28,316 | ||
| 6129 | £25,067 | £25,631 | ||
| 7111 | £25,056 | £25,977 | ||
| 9241 | £24,896 | £26,262 | ||
| 8146 | £24,813 | £25,552 | ||
| 6111 | £24,742 | £24,387 | ||
| 4216 | £24,678 | £25,593 | ||
| 7112 | £24,622 | £24,294 | ||
| 6221 | £24,279 | £24,075 | ||
| 6114 | £24,278 | £24,827 | ||
| 5435 | £24,228 | £24,601 | ||
| 9223 | £24,130 | £24,674 | ||
| 6222 | £24,124 | £24,371 | ||
| 7114 | £23,783 | £23,588 | ||
| 3232 | £23,717 | £23,814 | ||
| 5443 | £23,713 | £23,416 | ||
| 9224 | £23,331 | £23,453 | ||
| 9265 | £23,182 | £22,454 | ||
| 9264 | £22,936 | £22,787 | ||
| 9263 | £22,886 | £22,825 | ||
| 9267 | £22,294 | £22,456 | ||
| 9232 | £21,678 | £24,862 | ||
| 9266 | £21,598 | £20,617 | ||
| 6113 | £21,448 | £23,006 | ||
| 6112 | £21,239 | £21,488 | ||
| 3413 | Not published | Not published | ||
| 6250 | Not published | Not published | ||
| 6137 | Not published | £28,216 | ||
| 1135 | Not published | Not published | ||
| 7121 | Not published | £46,222 | ||
| 4214 | Not published | £45,661 | ||
| 3414 | Not published | Not published | ||
| 2253 | Not published | Not published | ||
| 1258 | Not published | £104,017 | ||
| 8215 | Not published | £60,487 | ||
| 1233 | Not published | Not published | ||
| 1112 | Not published | £37,420 | ||
| 9249 | Not published | Not published | ||
| 8133 | Not published | £57,264 | ||
| 9233 | Not published | Not published | ||
| 9112 | Not published | Not published | ||
| 1252 | Not published | Not published | ||
| 7124 | Not published | £27,726 | ||
| 7214 | Not published | Not published | ||
| 3311 | Not published | Not published | ||
| 1161 | Not published | Not published | ||
| 2226 | Not published | £40,456 | ||
| 6117 | Not published | £21,128 | ||
| 3312 | Not published | Not published | ||
| 2462 | Not published | £47,825 | ||
| 2435 | Not published | Not published | ||
| 1163 | Not published | £72,167 | ||
| 3512 | Not published | £57,388 | ||
| 3431 | Not published | Not published | ||
| 5243 | Not published | £36,436 |
The £12.99 PayPrecise Pay Rise Blueprint uses your confirmed occupation and salary to estimate a position between the full published ONS points. It then shows take-home pay, the value of a realistic next step, pay-rise scenarios and your True Wage after work time and costs.
Confirm your occupation and salary to get your job-pay position, BUILD / ASK / EXPLORE move, Next Pay Marker where supported, Your True Wage and a practical Pay Rise Plan.
The 20 lowest paid jobs in the UK
The same measure, read from the bottom. These are the lowest published full-time medians in the ONS dataset.
| # | Occupation | SOC | Median full-time pay |
|---|---|---|---|
| 1 | 6112 | £21,239 | |
| 2 | 6113 | £21,448 | |
| 3 | 9266 | £21,598 | |
| 4 | 9232 | £21,678 | |
| 5 | 9267 | £22,294 | |
| 6 | 9263 | £22,886 | |
| 7 | 9264 | £22,936 | |
| 8 | 9265 | £23,182 | |
| 9 | 9224 | £23,331 | |
| 10 | 5443 | £23,713 | |
| 11 | 3232 | £23,717 | |
| 12 | 7114 | £23,783 | |
| 13 | 6222 | £24,124 | |
| 14 | 9223 | £24,130 | |
| 15 | 5435 | £24,228 | |
| 16 | 6114 | £24,278 | |
| 17 | 6221 | £24,279 | |
| 18 | 7112 | £24,622 | |
| 19 | 4216 | £24,678 | |
| 20 | 6111 | £24,742 |
The bottom of this table is shaped by the National Living Wage more than by anything else. Once an occupation sits on the wage floor there is very little room between one job and the next, which is why the last dozen entries are separated by a few hundred pounds rather than a few thousand. Teaching assistants have the lowest published full-time median at £21,239.
Care, catering, retail and classroom support dominate the list. These are not low-skill jobs in any ordinary sense of the phrase, and several of them require qualifications. They are simply jobs where pay is set close to the statutory minimum, and a rise in the wage floor moves them all at once.
The highest paying jobs in the UK without a degree
The honest answer first. The ONS does not record whether a job needs a degree, so no official dataset can settle this cleanly. What it does record is the SOC major group, and two of those groups, skilled trades and process, plant and machine operatives, are where the standard way in is an apprenticeship, a trade qualification or training on the job.
| # | Occupation | SOC | Median full-time pay | Average full-time pay |
|---|---|---|---|---|
| 1 | Train and tram driversDetailed guide | 8231 | £76,327 | £75,860 |
| 2 | 5236 | £64,322 | £65,069 | |
| 3 | 8234 | £57,088 | £58,716 | |
| 4 | 5249 | £48,571 | £51,877 | |
| 5 | 8221 | £46,463 | £51,173 | |
| 6 | 8153 | £46,403 | £48,467 | |
| 7 | 5234 | £45,779 | £49,529 | |
| 8 | 5250 | £45,150 | £47,659 | |
| 9 | 5330 | £45,021 | £46,820 | |
| 10 | 5214 | £42,580 | £40,698 | |
| 11 | 5246 | £41,662 | £44,015 | |
| 12 | 8151 | £41,548 | £43,899 |
Rail runs away with it. Train and tram drivers top the list at £76,327, and rail appears four times in the top six. A train driver on the median earns more than the median solicitor, accountant or software developer in this same dataset, which is the single most useful fact on this page for anyone weighing up university against an apprenticeship.
Widen the definition and the shape changes. Plenty of managers and directors have no degree, and if you fold in that group then information technology directors at £91,671 and directors in logistics, warehousing and transport at £83,447 both belong here. We have left them out because “director” is where a career ends up, not a route you can apply for at eighteen. The electrician and plumber guides cover the trades routes in more detail.
How rare is a £50,000 occupation median?
The list narrows quickly once the salary threshold rises. Of the 382 occupations with a published full-time median, 56 reach £50,000, 18 reach £60,000 and only nine reach £75,000.
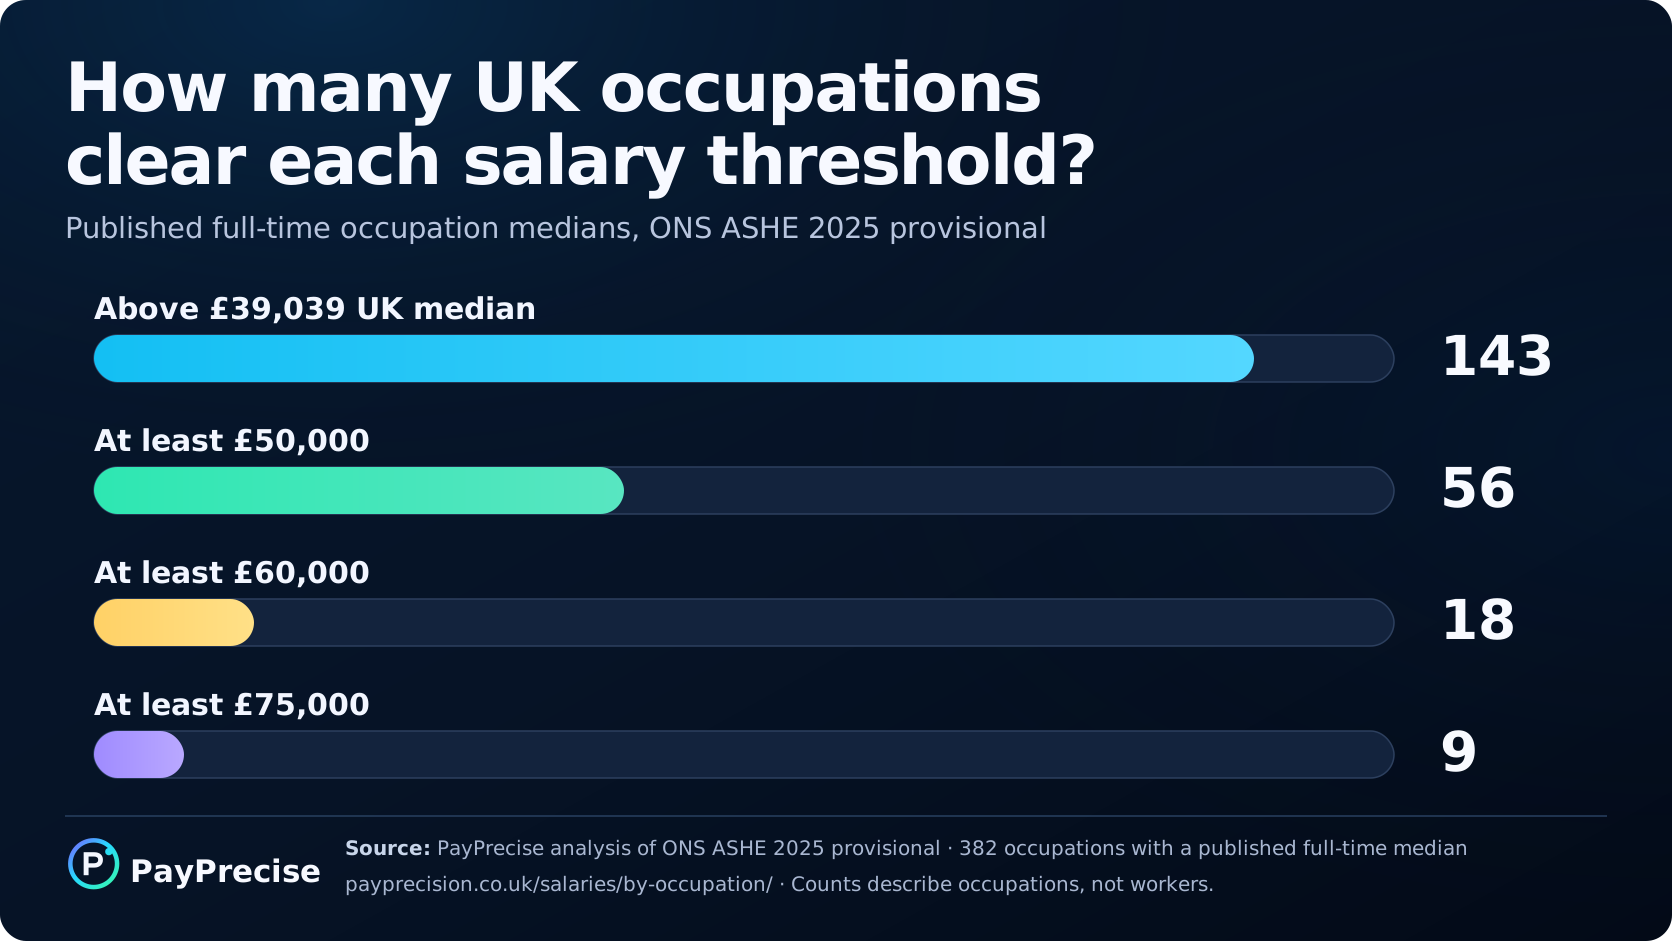
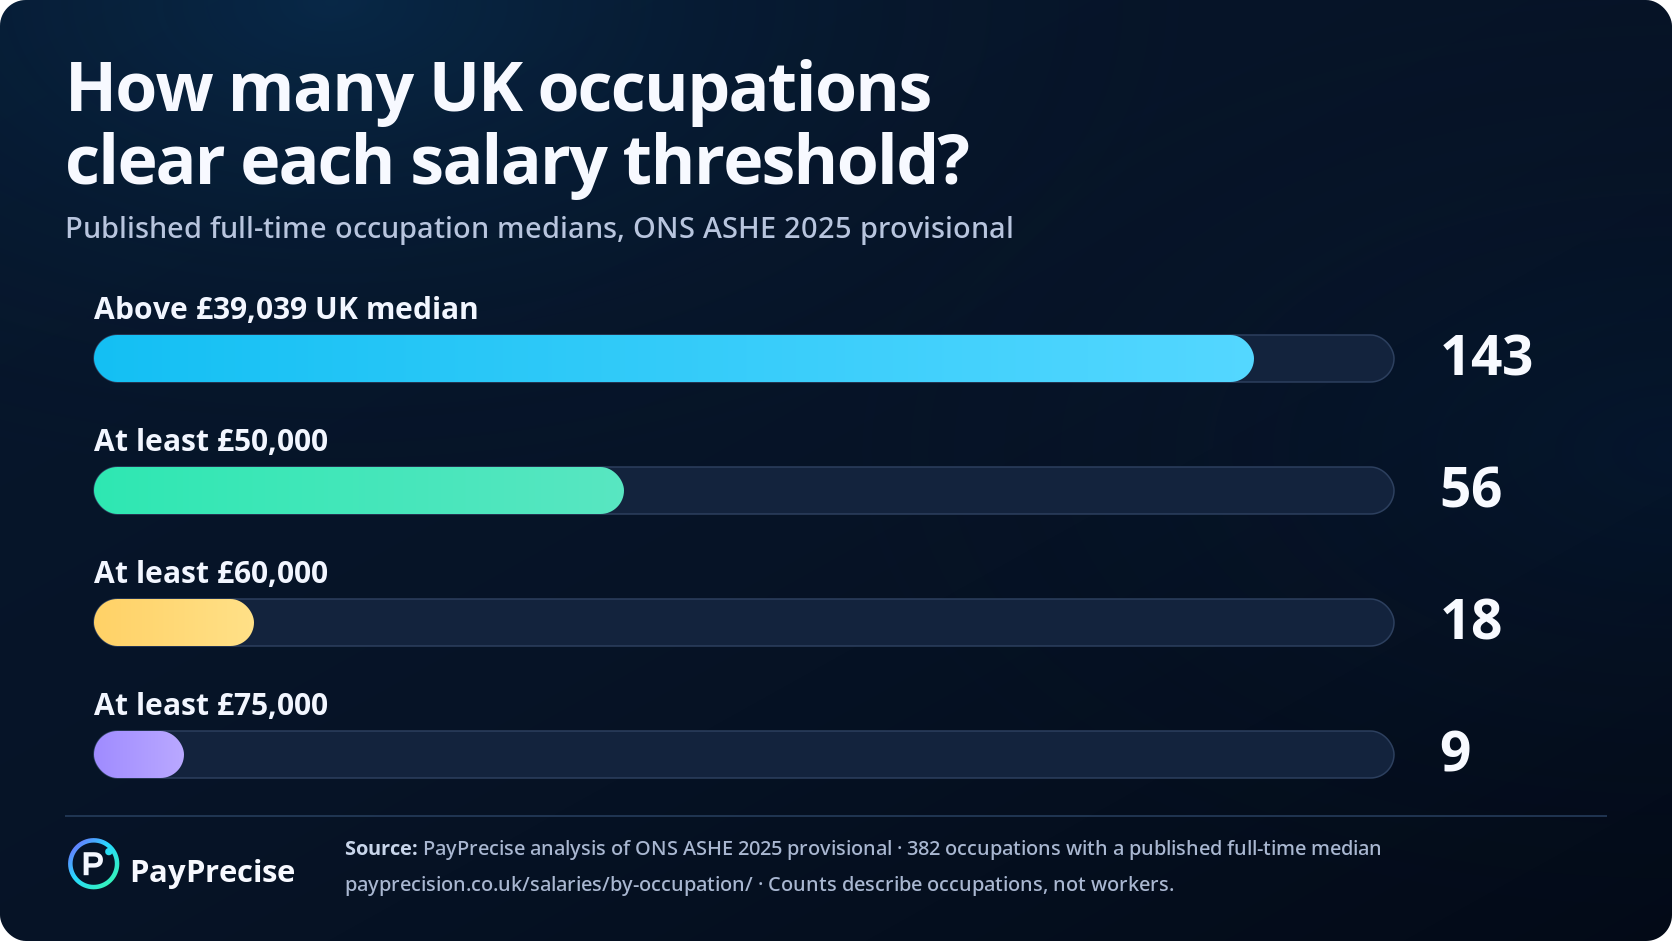
Ten of the top 20 are explicitly director, manager, executive or senior-official groups. Train and tram drivers are the exception that stands out: they rank eighth overall and above every engineering occupation in the same dataset.
Download the salary summary
The public files contain the SOC code, occupation name, median, average, 25th and 75th percentile points where published, and a plain-English quality label. They cover full-time, part-time and all employee jobs.
The download is designed for checking and comparing the national market. It does not calculate a personal position, take-home pay, Your True Wage or a Next Pay Marker.
Based on ONS ASHE Table 14, 2025 provisional data. Reuse is subject to the Open Government Licence v3.0 and should acknowledge the ONS source and PayPrecise transformation.
A few useful points before comparing jobs
These comparisons are not a league table of “good” and “bad” jobs. Hours, location, security, pension, progression and the cost of doing the work can materially change what a salary is worth.
Why typical and average pay can be different
The median is the middle employee job when salaries are placed in order. The average adds all pay together and divides it by the number of jobs.
A smaller number of very high salaries can pull the average upwards. That is why the typical figure is usually the better starting point for a broad comparison, while the average can still reveal a long, well-paid upper end.
The lower-middle and higher-middle figures shown after choosing a job are the published 25th and 75th percentiles. They describe the national distribution; they are not labels for junior and senior workers.
How this salary table was prepared
The figures come from the Office for National Statistics Annual Survey of Hours and Earnings, Table 14, 2025 provisional edition. PayPrecise matched the official four-digit SOC 2020 occupation codes and kept suppressed figures blank rather than filling them with an estimate.
ASHE covers employee jobs and excludes the self-employed. Annual pay estimates normally relate to employees who have been in the same job for more than one year. Job counts are indicative and some occupation estimates carry more uncertainty than others.
For detailed definitions, source files and assumptions, see the PayPrecise methodology and the ONS ASHE release.
| Dataset version | 1.1 |
|---|---|
| Published | 26 July 2026 |
| Last updated | 2 August 2026 |
| ONS edition | 2025 provisional |
| Earnings period | April 2025 |
| Occupation coverage | 412 four-digit SOC 2020 groups |
| Source check | Matched against the canonical ONS import used across PayPrecise |
Highest paying jobs in the UK: common questions
What is the highest paying job in the UK?▼
Chief executives and senior officials have the highest median full-time salary in the ONS data at £99,944 a year. The highest paid profession, as opposed to a management title, is specialist medical practitioners and consultants at £92,847.
What is the lowest paid job in the UK?▼
Teaching assistants have the lowest published full-time median at £21,239. Most of the occupations near the bottom sit close to the National Living Wage, so the gaps between them are small.
What is the highest paying job without a degree?▼
Train and tram drivers at £76,327, based on the skilled trades and machine operative groups where an apprenticeship or trade qualification is the usual route in. The ONS does not publish qualification requirements, so this uses occupation group as the proxy.
What is the average UK salary by job?▼
There is no single answer, which is the point of the table. Across the 382 occupations with a published full-time median, the midpoint is £35,426 and 143 pay more than the UK full-time median of £39,039.
Why is my job title not listed exactly?▼
ONS groups related job titles under official SOC occupation names. Search for the closest profession or task, then check that the group description matches the work you actually do.
Does this include self-employed income?▼
No. ASHE covers employee jobs. Turnover, day rates and business revenue should not be compared directly with an employee salary.
Why are some salaries not published?▼
ONS suppresses some figures where the sample is too small, uncertain or unsuitable for publication. PayPrecise leaves those values blank rather than guessing.
Can this page tell me my salary percentile?▼
No. It gives the national market view. The personalised report uses your confirmed occupation and salary to estimate where you sit between the full published points and what a realistic next step could mean after tax.